Retracing Our Steps
From "wouldn't it be cool if my walk spelled something" to a service that tests seven route-matching strategies against ten cities before picking one. This is the whole story, bugs and all.
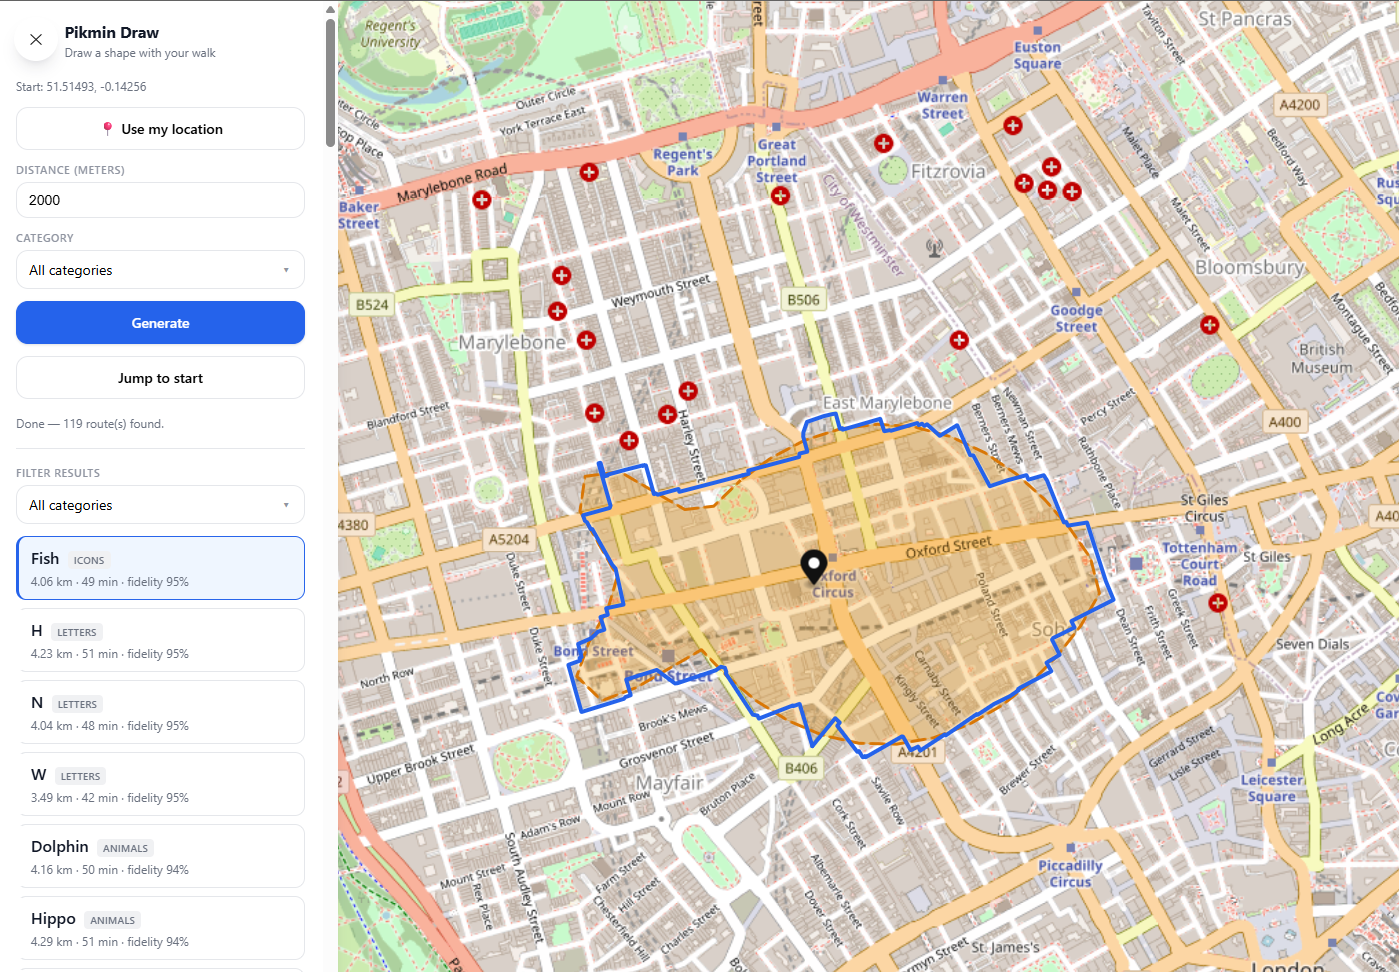
Here's the pitch, and honestly the whole idea: what if your walk could draw something?
Not metaphorically — literally. You open a map, drop a pin near you, pick a shape, and the app finds a loop through real streets that traces that shape when you look at it from above. A bear. The letter Q. A fish. You walk it, and somewhere a GPS trace exists that looks unmistakably like a fish sitting on top of your neighborhood.
Blame Pikmin Bloom
The actual origin is embarrassingly simple: one of us was playing Pikmin Bloom, a walking game where you plant flowers as you go and grow a little trail of Pikmin behind you. It's a lovely idea — turning an ordinary walk into something with a visible trace — but the trace itself is just wherever you happened to wander. There's no shape to it, no punchline. It's decoration on top of a walk, not a walk with a destination that means something.
The "what if" was obvious in hindsight: what if the trail wasn't random? What if you could choose what your walk drew, and the app worked backward from that to find you an actual route? Not through Pikmin's licensed characters — we like not getting sued — but through anything: animals, tools, letters, whatever a shape library could hold. The project ended up named pikmin-draw as a nod to where the idea came from, even though (we checked, and then deliberately didn't build) actual Pikmin silhouettes never made it into the shape library — those are Nintendo's characters, not an open icon set, and shipping them without asking wasn't a risk worth taking for a side project.
That "what if" is a much harder engineering problem than it sounds, and this post is the story of chasing it — from a five-shape script that only worked in one neighborhood in New York, to a deployed service that's now been measured against ten cities on four continents.
Feel Free to try it out : https://pikmin-draw.meaily.fyi
The first version: five shapes and a lot of hope
Version zero was a Python script. Five hand-drawn shapes — nothing imported yet — normalized into a 0–1 coordinate space, placed near a real coordinate, snapped onto a street graph fetched live from OpenStreetMap, and chained into a route with plain shortest-path search. No search over placements yet, either: one scale, one rotation, whatever fell out fell out.
We tested it at Union Square, New York, because dense Manhattan-adjacent grids are about as forgiving as street data gets. A triangle traced at 66% fidelity. A square at 78%. Good enough to prove the idea wasn't insane, bad enough that the very next thing we built was a way to try more than one placement and keep whichever one looked best — scale × rotation, pick the winner by shape fidelity instead of by whichever guess came first. That one change took the triangle to 87% and the square to 92%, on the same streets, same shape, same everything else. It was the first real proof that "search more, then judge" would end up being the shape of almost every improvement that followed.
We also caught our first real bug there: routes that walked out to a dead end and walked straight back, an exact there-and-back spike with zero shape value. A small stack-based cleanup pass — cancel any immediate edge reversal, repeat until none are left — erased it. It's still in the pipeline today, quietly doing its job every time a route touches a cul-de-sac.
Growing a library, then growing up into an app
Five shapes became 55 via an SVG-import pipeline that could take any icon set and turn its outlines into templates — with a "traceability filter" rejecting anything too intricate, too thin, or too self-intersecting to ever look good as a walking route. 55 became 89, then 145, sourced from Font Awesome and OpenMoji, organized into categories (animals, tools, fruits, letters extracted straight from font glyphs), each shape's license tracked so nothing shipped without knowing where it came from.
But a shape library and a CLI script aren't a product. The real pivot was ripping the generation pipeline out of the command-line tool and putting a real service around it: a small backend that takes a request and hands back a job ID immediately, a Redis queue, and a worker process that does the actual (sometimes slow) work of fetching street data and searching for the best route — polling for status, live progress, the works. The frontend went from "load a static file and look at it" to "click a point on the map, pick some categories, watch a progress bar, browse results" — the thing you'd actually want to use, not just the thing that proved the concept.
Then it went to production: three services (frontend, backend, worker) as containers on Google Cloud Run, deployed through Cloud Build, sitting behind a real domain. And immediately, production found problems a laptop never would.
Three attempts at getting map data
Getting street data turned out to be its own multi-act saga, and it's the part of this project that most resembles a normal ops war story.
Act one was the obvious thing: query OpenStreetMap's live Overpass API for whatever area a request needed. It worked on a laptop. In production, it didn't — overpass-api.de throttles or blocks a lot of cloud-provider IP ranges, and the underlying library's own DNS resolution had its own crash bug on top of that. Live queries from a GCP worker were, it turned out, genuinely unreliable — not "flaky," reliably broken.
Act two was the fix that made sense at the time: stop asking a live API, and just own the data. We split all of England into 47 county-sized extracts, pre-built each into a walking graph offline, and published them to a private storage bucket that the worker could pull from on demand, with a small in-memory cache so it wasn't re-downloading the same tile constantly. It worked — but "own the data" meant owning the maintenance: building a dense county like Greater London needed multiple gigabytes of memory, the whole pipeline needed its own bounding-box manifest to know which tile covered which request, and — this is the part that stung — it only ever covered England. Anyone who wanted to draw a shape in New York was out of luck, on a project literally trying to prove "anywhere."
Act three — the one that stuck
We found a hosted OSM API (MapLark) with global coverage and generous free usage, and rebuilt the graph-fetching layer around it. The raw data it returns doesn't carry explicit shared-node topology — same limitation as any OSM-to-GeoJSON conversion — so we reconstruct the graph ourselves by deduplicating nodes on exact coordinate match, then let the same graph-simplification step we'd always used collapse the rest. Verified against a known-good self-hosted tile before switching over: same order of magnitude in nodes and edges, 99% of the network landing in one connected piece. No more tile pipeline, no more England-only limit, no more multi-gigabyte builds. Sometimes the second rewrite is the one that was actually right.
Making it fast enough to actually use
A route generation request that takes two minutes is a request nobody waits for. Two fixes did most of the work here, and neither one changed the algorithm at all — they just stopped it from doing the same expensive thing over and over for no reason.
The first: the nearest-street-node lookup was rebuilding its entire search structure from scratch on every single call, and the candidate search calls it constantly against the exact same unchanged graph — profiling put this at roughly half of total runtime, for work that produced an identical answer every time. Cache it once per graph, reuse it for the rest of the batch. The second: the fidelity check was doing thousands of individual point-to-point distance calls in a Python loop where one vectorized array operation would do — same math, one calculation instead of thousands. Together: a 145-shape batch went from 121 seconds to 28 seconds locally, no algorithm changed, just waste removed.
The other kind of speed fix was more of a judgment call: the candidate search originally tried 18 placements per shape (3 scales × 6 rotations). Cutting it to 6 (2 scales × 3 rotations) made everything 3.3× faster for an average fidelity cost of well under a single percentage point. That one trade-off — fewer candidates, tuned deliberately rather than guessed — became the seed of everything in the rest of this post: once "how many candidates, judged how" was something we'd already had to think hard about once, it was only a matter of time before we started asking whether 6 was still the right number, and whether "judged how" was hiding a bigger lever than "how many."
Shapes that didn't look like anything
Before touching the routing algorithm at all, we had to fix what it was routing toward. The shape library — 145 templates imported from icon sets — had a quiet bug: multi-part icons (a bell pepper's three lobes, a cowboy hat's crown and brim, a bear's snout and ears) were reduced to whichever single sub-path happened to have the biggest bounding box. A bear became an ear. A pepper became a lobe. About 30% of the library didn't resemble what it claimed to be.
The fix was a buffered-polygon union: take every sub-path big enough to matter, grow a buffer around all of them in lockstep until they fuse into one connected outline, then shrink back by the same amount. Unlike a convex hull — which can only bulge outward — this preserves the concave notches that make a shape recognizable: the dip between a pepper's lobes, the line between a hat's brim and crown.
145 → 119 shapes after re-extraction & cleanup
18 shapes fixed by the new extractor
26 removed — no fix made them recognizable
That's a separate story from the one below, but it set the baseline: once the templates were trustworthy, "does the route look like the shape" became a question worth actually optimizing.
Routes that walk over themselves
The matching pipeline places a template at several scales and rotations near the start point, snaps each placement's points onto the nearest streets, and chains shortest paths between them. Whichever placement scores best against the template wins. That worked — average shape fidelity around 88% on a 119-shape test library against real central London streets — but a meaningful share of winning routes doubled back on themselves: 5.0% of a route's street segments, on average, got walked twice, and one shape in five, at worst, retraced nearly a fifth of its own path.
The obvious fix: make the pathfinder avoid streets it's already used. We tried it twice, and both times the obvious fix was wrong.
Attempt 1 — penalize reused streets
Multiply the length of any already-walked street by a fixed factor before the next leg's shortest-path search, so the router prefers something else. Simple, and it made both numbers worse. Average backtracking went up (5.0% → 6.2%+) as the penalty increased, and fidelity fell.
Why it failed
Most repeated streets aren't a routing mistake — they're a route's closing leg landing back near where it started (true of any closed loop), or the only street into a real cul-de-sac. Penalizing that street doesn't remove the repeat; it forces a long detour around a corner that was never optional. One shape (a house icon) went from a 3,211m route with 8 repeated segments to a 5,448m route with 21.
Attempt 2 — reroute only when it's actually free
Smarter version: before accepting a repeated street, check whether a comparably short alternative exists that avoids it entirely — capped at 25% extra distance — and only take it if so. This stopped the blow-ups. It also cost almost nothing in return: 54% of all route legs triggered the extra search, and only 6.4% of those found an alternative worth taking. We paid for a second shortest-path search on the other 93.6% for nothing. Net result: generation time roughly doubled for a backtracking improvement of 5.0% → 4.7%.
What actually worked
The search already generates every scale/rotation candidate before picking a winner — that cost is already paid. So instead of changing how routes get built, we changed how the winner gets picked: rank the already-computed candidates by fidelity minus a backtracking penalty, instead of fidelity alone.
The trade that actually paid off
Same candidates, same search cost, new tie-break rule. Average backtracking dropped from 5.0% to 2.7% — nearly half — for a fidelity cost too small to matter (88.0% → 87.4% average). Zero extra milliseconds.
If the tie-break rule matters this much, make it swappable
Once "how candidates get ranked" turned out to be the real lever, the obvious next question was: what else could that rule optimize for? We generalized it into a small registry of named implementations — each one a candidate grid (how many scale/rotation placements to try) plus a ranking rule (fidelity alone, or fidelity discounted by backtracking) — configurable per worker deployment, per job, or from the command line. Then we swept it.
The single biggest lever for pure shape resemblance, it turned out, wasn't grid size at all — it was whether the ranking rule cared about backtracking in the first place. Switching the exact same 18-candidate search from backtrack-aware to pure-fidelity ranking took worst-case fidelity from 77.0% to 80.0%, at identical cost. Grid density on top of that bought smaller, diminishing gains.
84%86%88%90%10ms100ms500msgeneration time per shape (log scale)avg fidelityfastbalancedprecisequalitythoroughultraextreme
Fig. 1 — Backtrack-aware implementations (grey) plot on their own frontier; pure-fidelity implementations (orange) sit consistently above it at the same or similar cost. Dashed line follows the seven implementations by generation time.
| implementation | candidates | ms / shape | fidelity avg | fidelity worst | backtrack avg |
|---|---|---|---|---|---|
| fast | 1 | 8.9 | 85.5% | 65.0% | 6.0% |
| balanced | 6 | 81.4 | 87.4% | 79.0% | 2.7% |
| precise | 18 | 175.4 | 88.7% | 80.0% | 5.2% |
| quality | 18 | 177.1 | 87.9% | 77.0% | 1.6% |
| thorough | 18 | 313.4 | 88.2% | 77.0% | 1.6% |
| ultra | 36 | 354.0 | 89.2% | 80.0% | 5.0% |
| extreme | 72 | 763.3 | 89.4% | 81.0% | 4.8% |
balanced — starred above — stays the production default: the best fidelity-per-millisecond for a full-library batch. precise and ultra are one config change away for anyone who'd rather trade a bit more backtracking for a noticeably better trace, and extreme is there for the one shape you actually care about, not a batch of 119.
Wait, does any of this hold up outside London?
Every number above came from one city. That's a reasonable way to develop something quickly and a bad way to trust it, so we cached graphs for nine more real locations — Manhattan and Barcelona's Eixample for strict grids, Paris and Amsterdam for organic historic cores, Tokyo and Sydney for dense-and-irregular, San Francisco for hills, a sleepy suburb outside Dallas for cul-de-sacs, and a small town in England's Lake District for "what does a genuinely sparse road network do to this" — and reran the entire seven-way comparison on each. 70 full runs, over 8,000 individual routes, and not one extra live API call beyond the ten graph fetches, because every graph gets cached exactly once and replayed forever after.
Two things came out of it, and only one was the one we expected.
Expected: the ranking holds
Pure-fidelity selection beat backtrack-aware selection on shape resemblance at all ten locations, no exceptions. The London-only conclusion wasn't a London-only fluke.
London was one of the hard ones
Under the production default, London scored 87.4% average fidelity — second-worst of the ten cities, beaten only by the rural test town. Eight of the other nine cities scored higher, some by five full points, on the exact same algorithm. We'd unknowingly been tuning against one of the harder cases the whole time — which, in fairness, probably means the numbers in this post are a conservative floor, not an optimistic ceiling. And backtracking itself turned out to swing by more than 10× between cities: strict grids like Manhattan barely ever need to repeat a street (0.3% of segments); London and a similarly old, tangled Amsterdam repeat 2–3%. The backtracking problem this whole post is about isn't universal — it's concentrated in exactly the kind of dense, historic, non-grid street pattern London happens to have.
The one thing no amount of clever selection fixed: the small English town. Fewer streets means fewer ways to approximate an arbitrary shape, full stop, and every one of the seven implementations — including the expensive one — scored lowest there. Some limits aren't algorithmic.
What we'd tell ourselves a year ago
The idea was never the hard part. "Draw a shape by choosing where you walk" is a sentence. Getting a real street network to cooperate with an arbitrary polygon is a few hundred commits.
Every "own the infrastructure" decision has a maintenance bill attached, due later. Self-hosting England's OSM data solved a real reliability problem and created a new one — multi-gigabyte builds and an England-only ceiling — that a better hosted API eventually solved for free.
The obviously-correct fix isn't obviously correct until you measure it on real streets. A synthetic grid graph never needs to backtrack — dead ends and single-entrance cul-de-sacs are what make backtracking-avoidance either matter or backfire, and only real street topology has them.
Look for the cheapest place to apply a fix, not just a correct one. The pathfinder version of backtrack-avoidance and the candidate-selection version solved the same problem; one cost nothing because the work was already being done anyway.
A "did it help" question is usually also a "compared to what, exactly, and where" question. Building the tooling to run every implementation against the same cached graphs — ten cities, zero live API calls after the first fetch — is most of why any of these numbers are trustworthy, and it's the same reason we caught that London wasn't a fair baseline in the first place.

![Information Security Series: [Part2] Principles of Privileges](https://cdn.hashnode.com/res/hashnode/image/upload/v1647290198557/daFz7fDND.png)